Setup
Once the performance POC is in progress, use the following steps and resources to monitor the performance.
Table of contents
Server Side
You can use the Cloud Monitoring for server side monitoring.
Client Side
Machmeters sets up a Grafana dashboard for client side monitoring. This dashboard looks like the following: -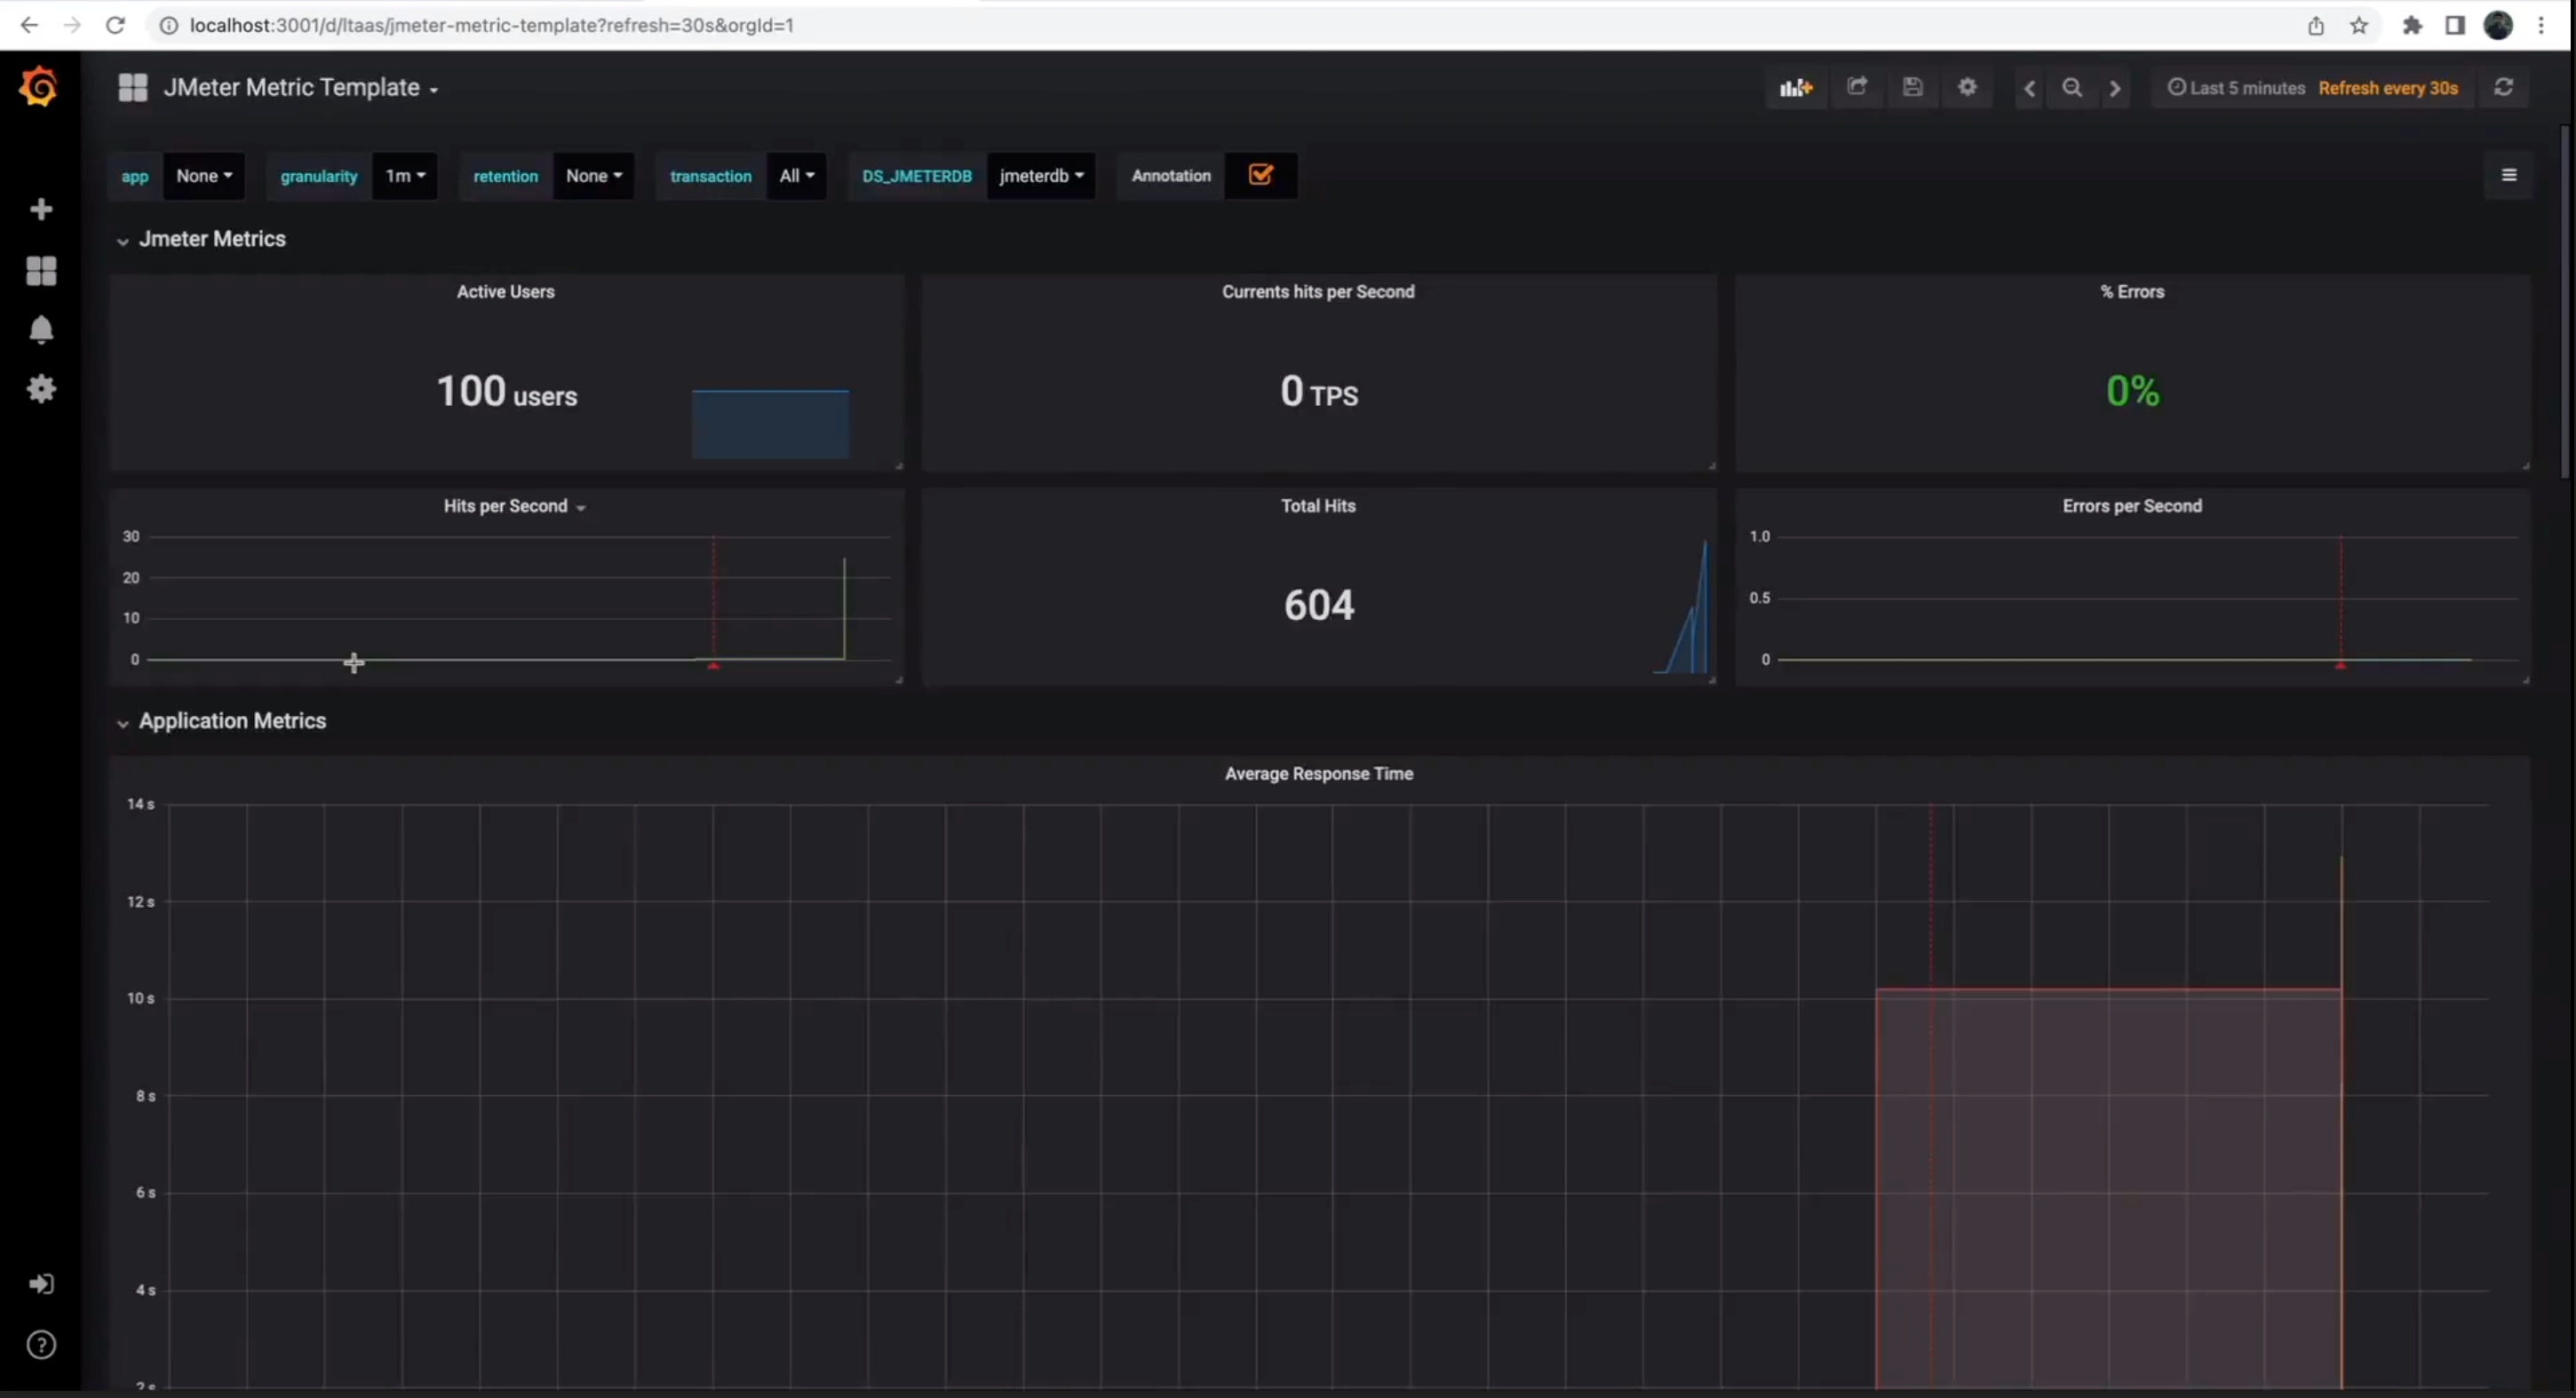
How to connect to grafana dashboard
# SSH port-forwording to grafana
kubectl port-forward -n spanner-test $(kubectl get po -n spanner-test | grep jmeter-grafana | awk '{print $1}') 3001:3000

# Grafana Dashboard
open http://localhost:3001