Part III - Running templates using Machmeter
Now that we have created the required infrastructure in Part I and created and executed our templates locally to ensure that they work in Part II, we will execute these templates at scale using Machmeter’s intuitive execute CLI command.
Table of contents
- Changes required for Machmeter compatibility
- Run the machmeter
executecommand for Data load - Run the machmeter
executecommand for Performance Test - Observe metrics at Client side
- Observe metrics at Server side
- Commit the templates
Changes required for Machmeter compatibility
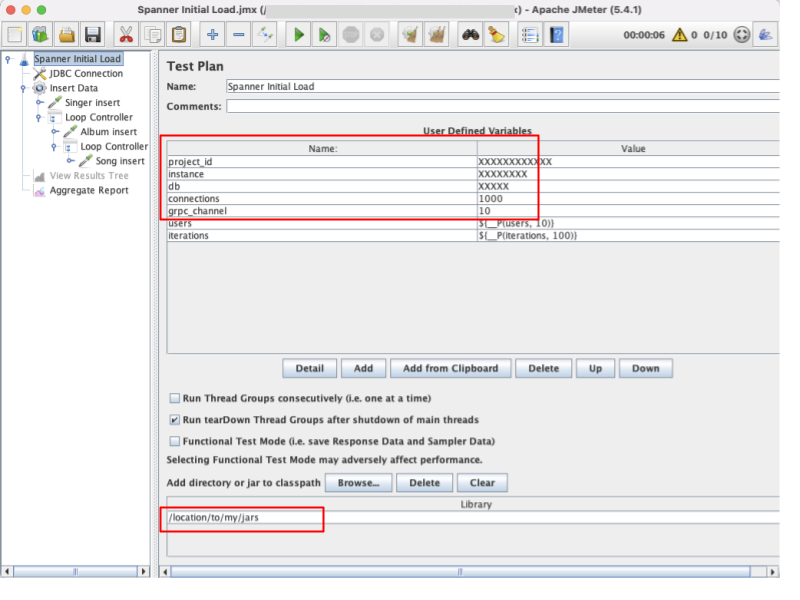
In Part II, we have updated the location of the JARs to our local filepath to run the templates locally. We need to revert this change to so that the Jmeter template can find the JARs when running inside a Kubernetes pod. Machmeter provides these dependencies at the /test/ location inside the docker image that is deployed to GKE. Hence, change the location back to /test/ in the templates. This can be found in “Test plan” screen.
Run the machmeter execute command for Data load
Modify the data-load JSON configuration at sample-configs/data-load.json to update the jMeterTemplatePath , instance and database configurations.
Then run the following:
$ java -jar target/machmeter/machmeter.jar execute sample-configs/data-load.json
Machmeter will bootstrap the template on the GKE cluster and start the execution with the parameters supplied in the JSON file above.
Run the machmeter execute command for Performance Test
Modify the perf-test JSON configuration at sample-configs/perf-test.json to update the jMeterTemplatePath, instance and database configurations.
Then run the following:
$ java -jar target/machmeter/machmeter.jar execute sample-configs/perf-test.json
Machmeter will bootstrap the template on the GKE cluster and start the execution with the parameters supplied in the JSON file above.
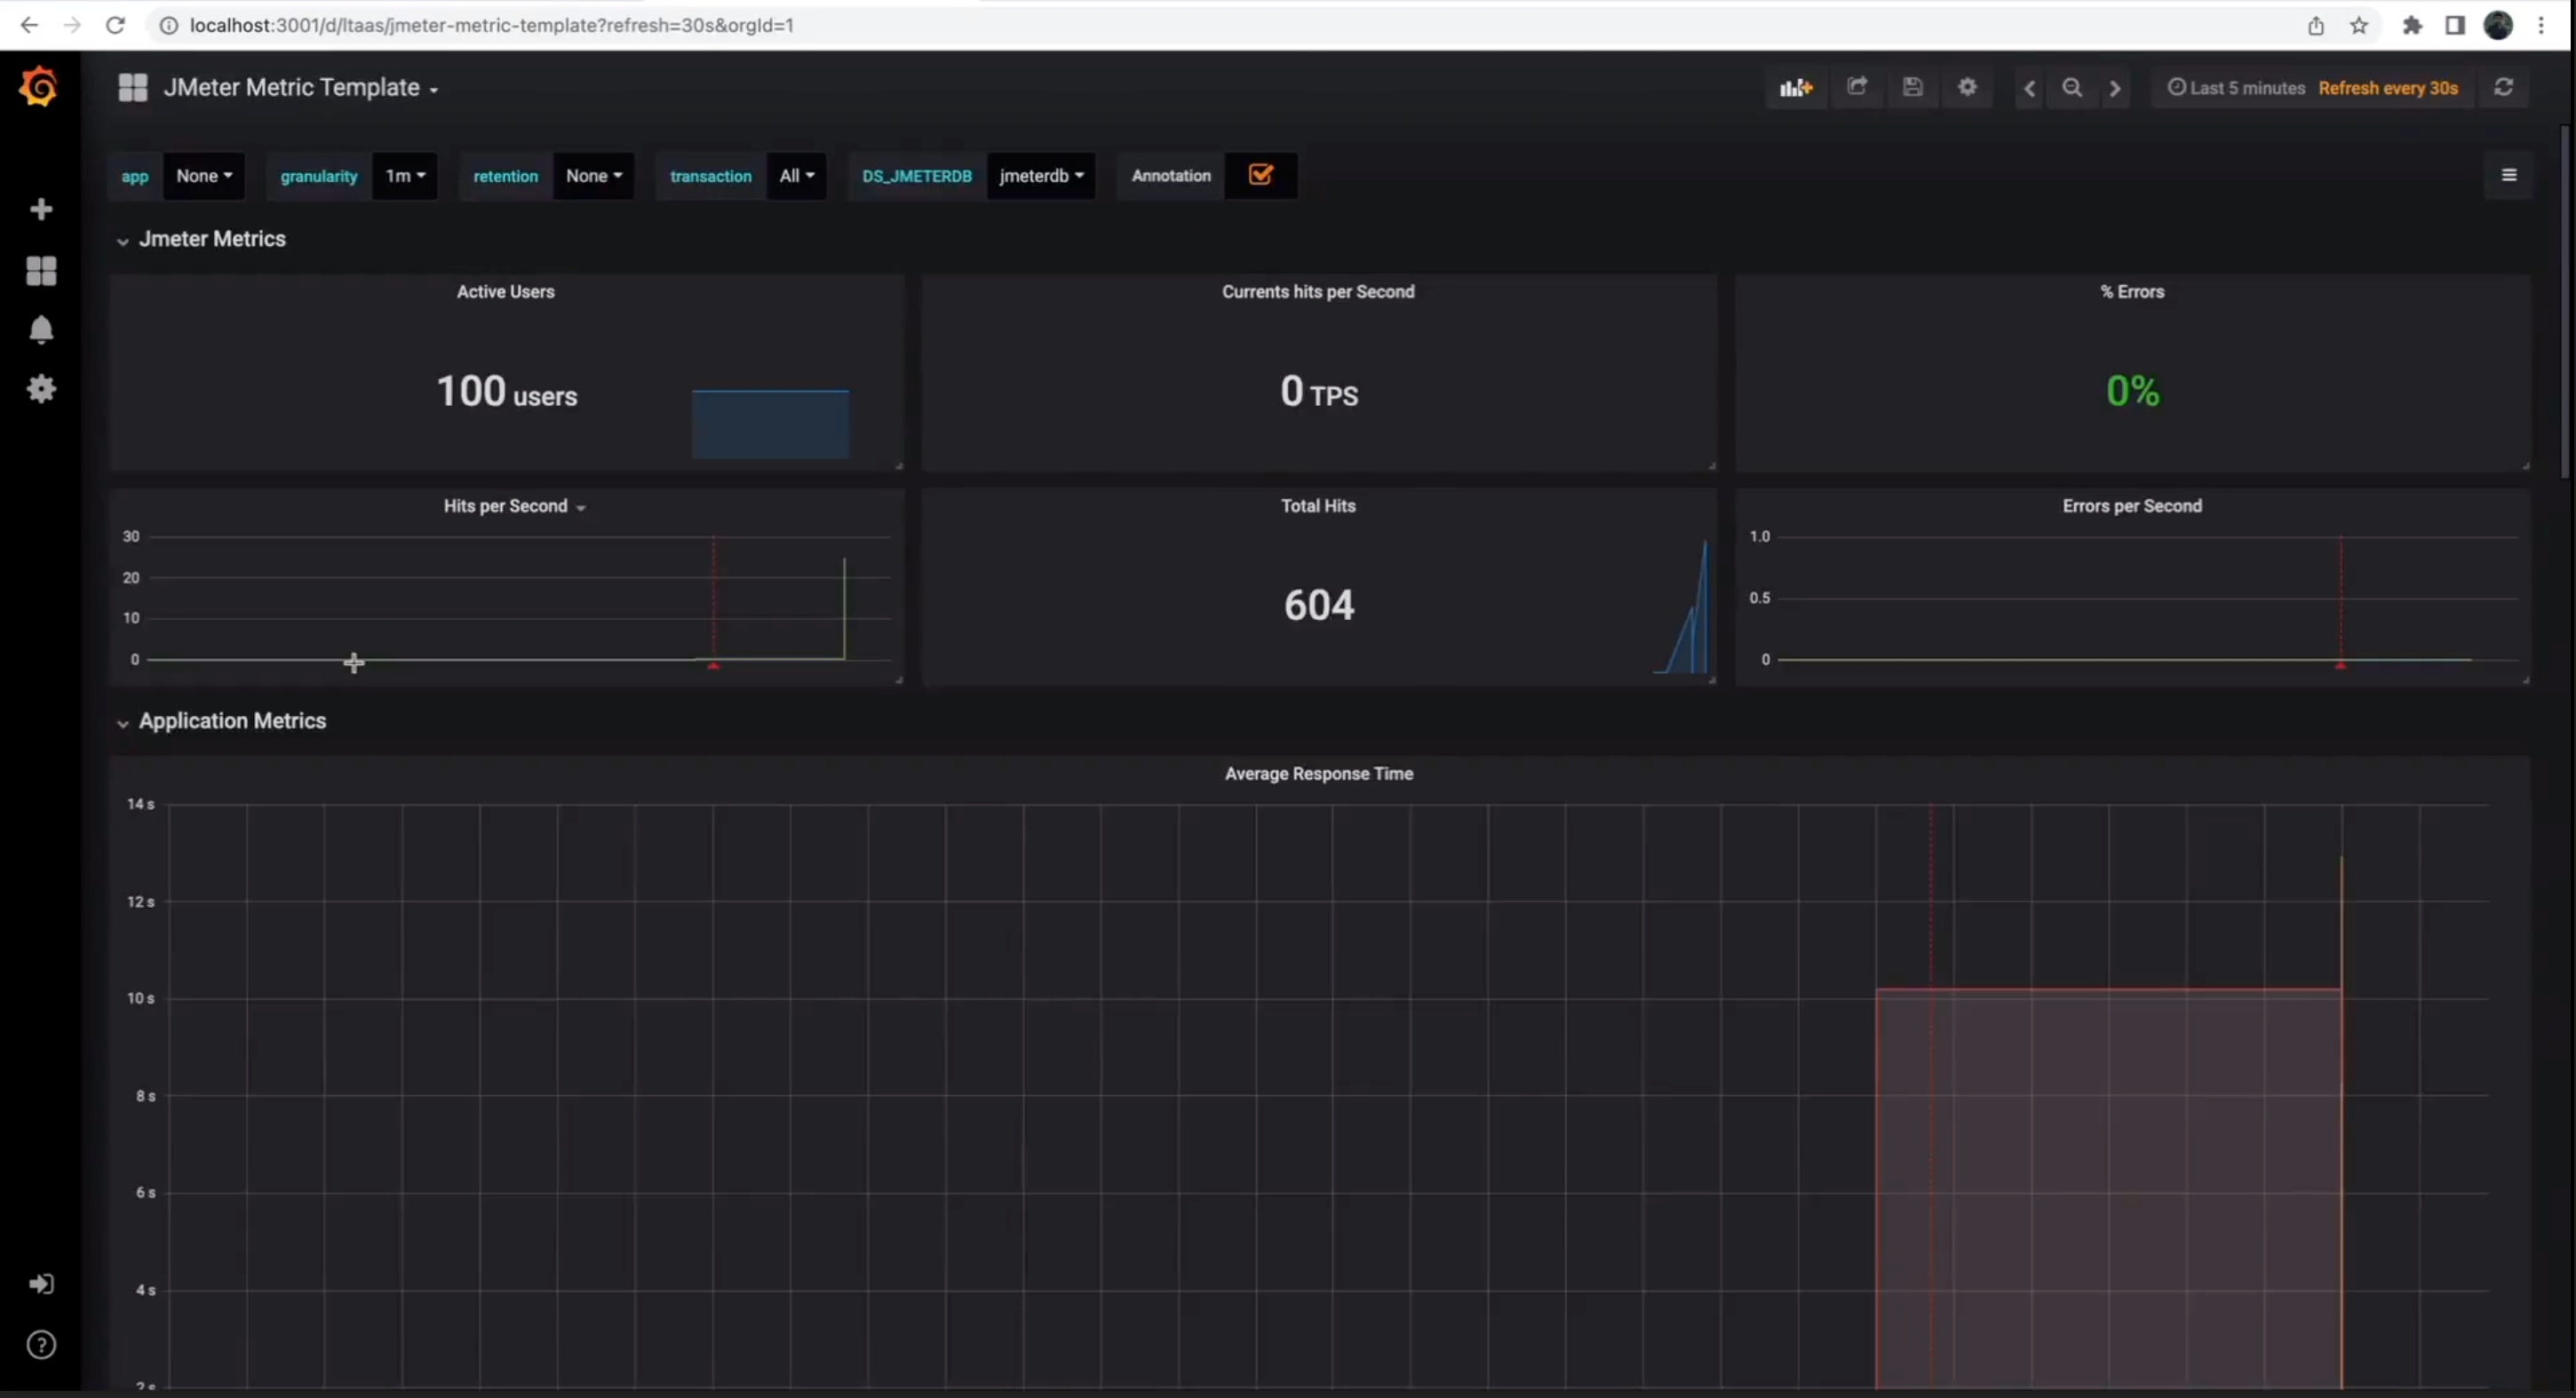
Observe metrics at Client side
Client side metrics aggregation can consume significant resources on the GKE cluster as the size of the load test increases. We recommend disabling the backend listener in the JMeter templates when targeting QPS generation requirements in excess of >20K.
Machmeter records telemetry from JMeter and shows the client side metrics on a Grafana dashboard. Grafana runs inside a separate pod in the GKE cluster. We can simply connect to it to view the dashboard -
gcloud container clusters get-credentials <CLUSTER_NAME> --region=<REGION>
kubectl port-forward -n <NAMESPACE> $(kubectl get po -n <NAMESPACE> | grep jmeter-grafana | awk '{print $1}') 3001:3000
Observe metrics at Server side
Spanner provides several metrics such as Instance Metrics , Transaction Insights & Lock Insights and Query insights to understand how Cloud Spanner is performing under the active load.
Commit the templates
Once both the SQL schema, Data load and Performance test templates are all working as expected, please commit them to the main repository by creating a Pull request .